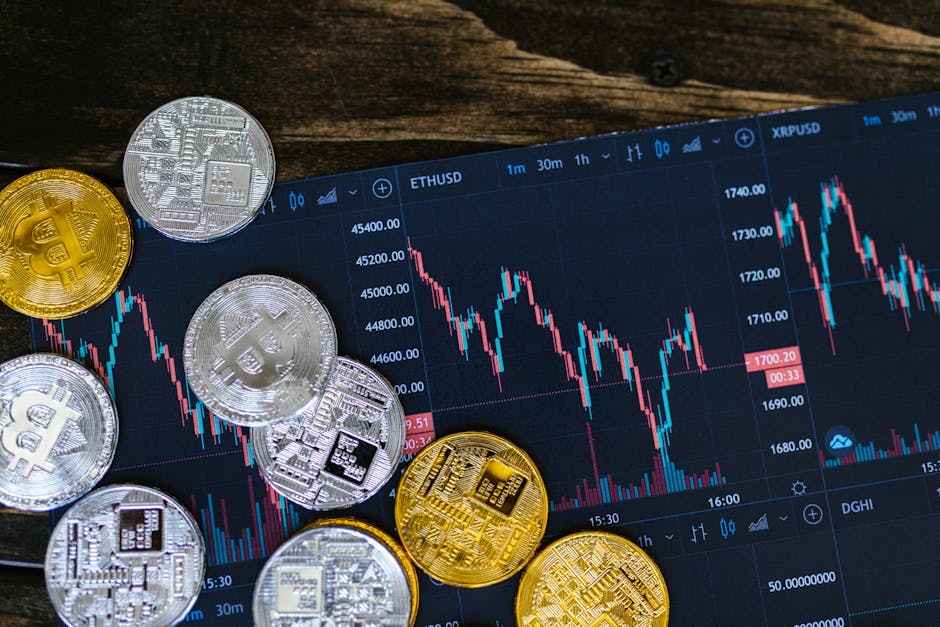
Gold and Silver Performance Update
The gold and silver spot market has ended the day unchanged, with both metals experiencing zero price movement as of March 12, 2026.
| Metal | Price (USD) | Change | % Change | Day High | Day Low |
|---|---|---|---|---|---|
| Gold (XAU) | 5103.90 | 0.00 | 0.00% | 5154.94 | 5052.86 |
| Silver (XAG) | 584.69 | 0.00 | 0.00% | 590.54 | 578.84 |
Gold (XAU) Analysis
Technical Analysis
The gold price has maintained a narrow trading range, with the day's high of $5154.94 and low of $5052.86. The lack of movement suggests a pause in the momentum that led to the recent price appreciation. The Relative Strength Index (RSI) is hovering around 50, indicating a balance between bullish and bearish forces.
Macro Analysis
The macroeconomic environment remains uncertain, with inflation concerns still prevalent amidst weakening economic indicators. The recent Fed statement hinted at a more dovish stance on interest rates, which may support gold prices in the short term. However, rising yields could offset some of this effect if they continue to increase. The ongoing Ukraine-Russia conflict and its impact on global supply chains contribute to market volatility.
Short-term Trading Bias
Hold: Gold's trading range and lack of momentum suggest a cautious approach. While inflation concerns may provide some support, the overall picture is neutral, making it difficult to establish a clear short-term bias.
Key Support and Resistance Levels
- Support: $5052.86
- Resistance: $5154.94
Silver (XAG) Analysis
Technical Analysis
Similar to gold, silver has also maintained a tight trading range, with the day's high of $590.54 and low of $578.84. The RSI is slightly below 50, indicating a mild bearish trend.
Macro Analysis
The macroeconomic drivers for silver are largely influenced by its industrial demand and inflation expectations. With the recent surge in global commodity prices, silver has gained some traction, but the lack of significant price movement suggests that the market is waiting for clearer direction from central banks or changes in economic indicators.
Short-term Trading Bias
Sell: Silver's mild bearish trend, coupled with its tight trading range, suggests a potential short-term selling opportunity. However, it's essential to monitor inflation and interest rate expectations closely as they may impact silver prices.
Key Support and Resistance Levels
- Support: $578.84
- Resistance: $590.54
Actionable Insights and Risk Management
Markets are prone to sudden changes in momentum, making risk management crucial for traders. It's essential to maintain a diversified portfolio and adjust positions according to changing market conditions.
In conclusion, the current trading environment is characterized by uncertainty, with gold and silver prices stuck in a narrow range. Traders should remain cautious and adapt their strategies based on macroeconomic developments and central bank decisions.
By Malik Abualzait
Comments
Post a Comment